Introduction
Overview
Section titled “Overview”Logs are a powerful tool for monitoring activity and troubleshooting issues.
Access your logs from the Logs page in the dashboard.
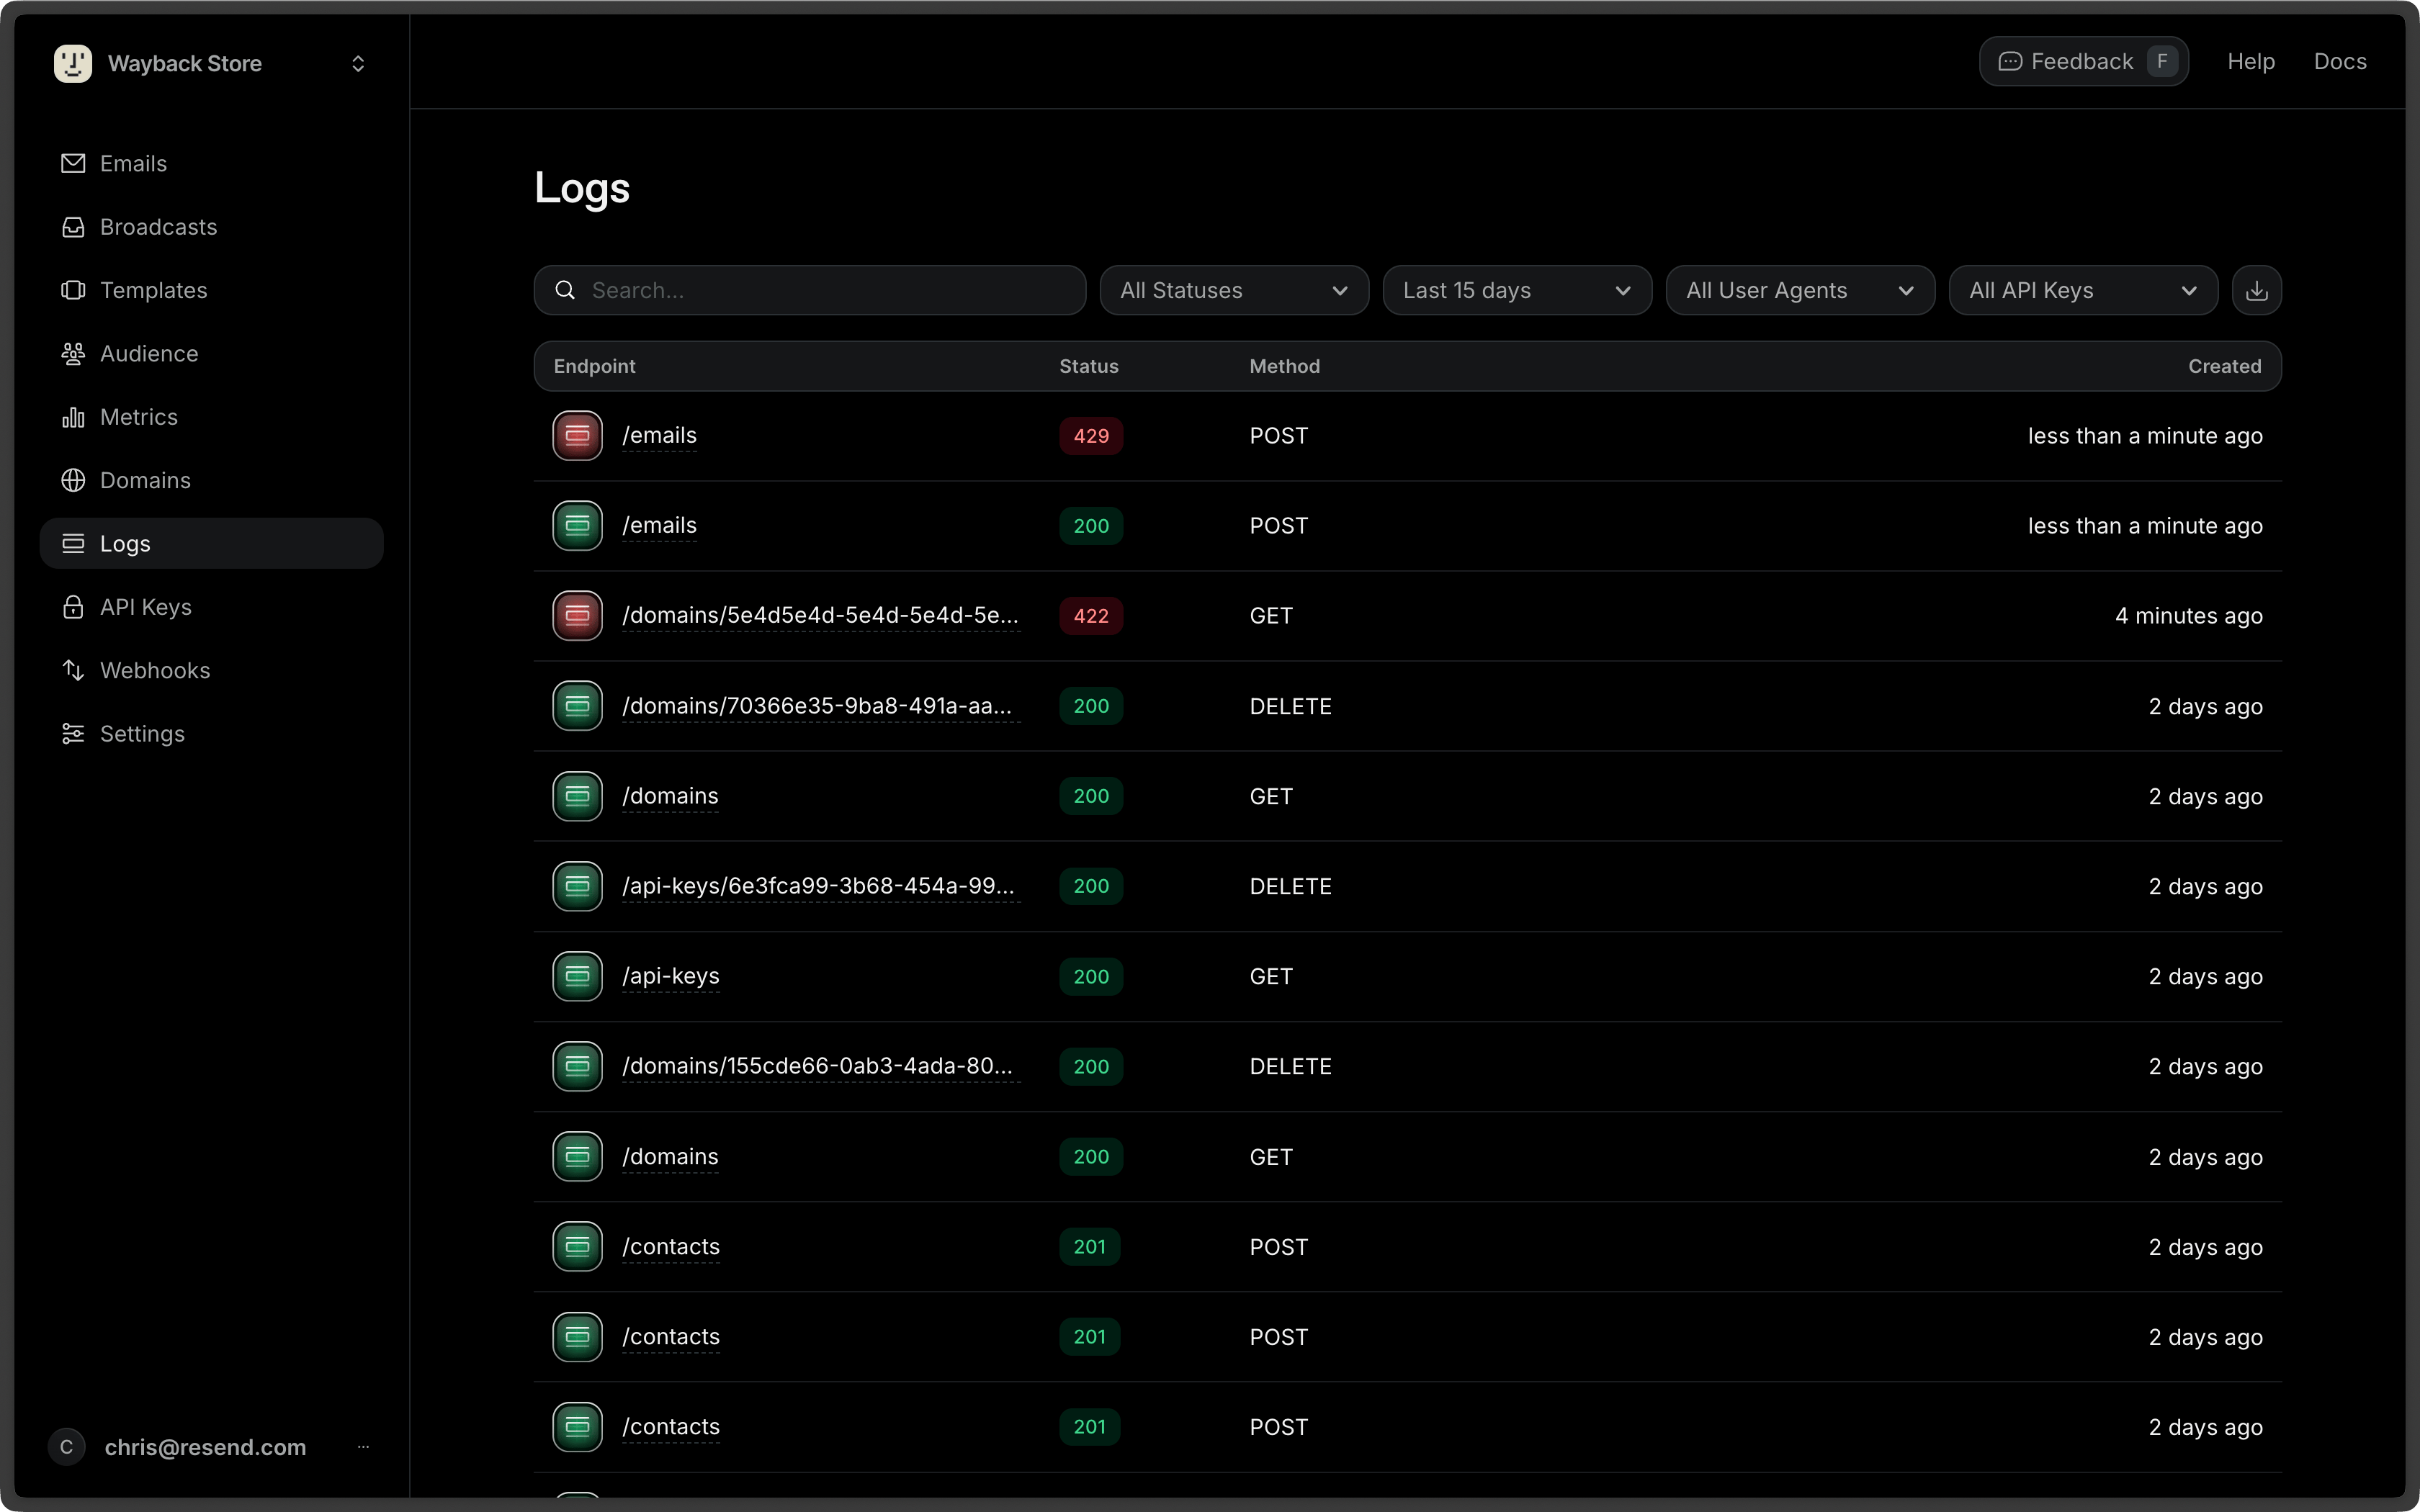
Each log entry shows:
- Endpoint - The API endpoint called (e.g.,
/domains,/api-keys,/contacts) - Status - The HTTP response status code (200, 201, etc.)
- Method - The HTTP method used (GET, POST, DELETE, etc.)
- Created - When the request was made (displayed as relative time)
Searching Logs
Use the search bar to find specific logs. This is useful when tracking down a particular request or debugging an issue.
Filtering Logs
Filter logs by response status to quickly identify issues:
- All Statuses - View all logs
- Successes - Show only successful requests (2xx status codes)
- Errors - Show only failed requests (4xx and 5xx status codes)
- Specific codes - Select one or more specific HTTP status codes (200, 201, 403, 429, etc.)
You can select multiple status codes to create custom filters.
- Date range - Adjust the time period for logs (e.g., Last 15 days)
- User Agents - Filter by SDK or client
- API Keys - Filter by specific API key
Log details
Click any log entry to view complete details.
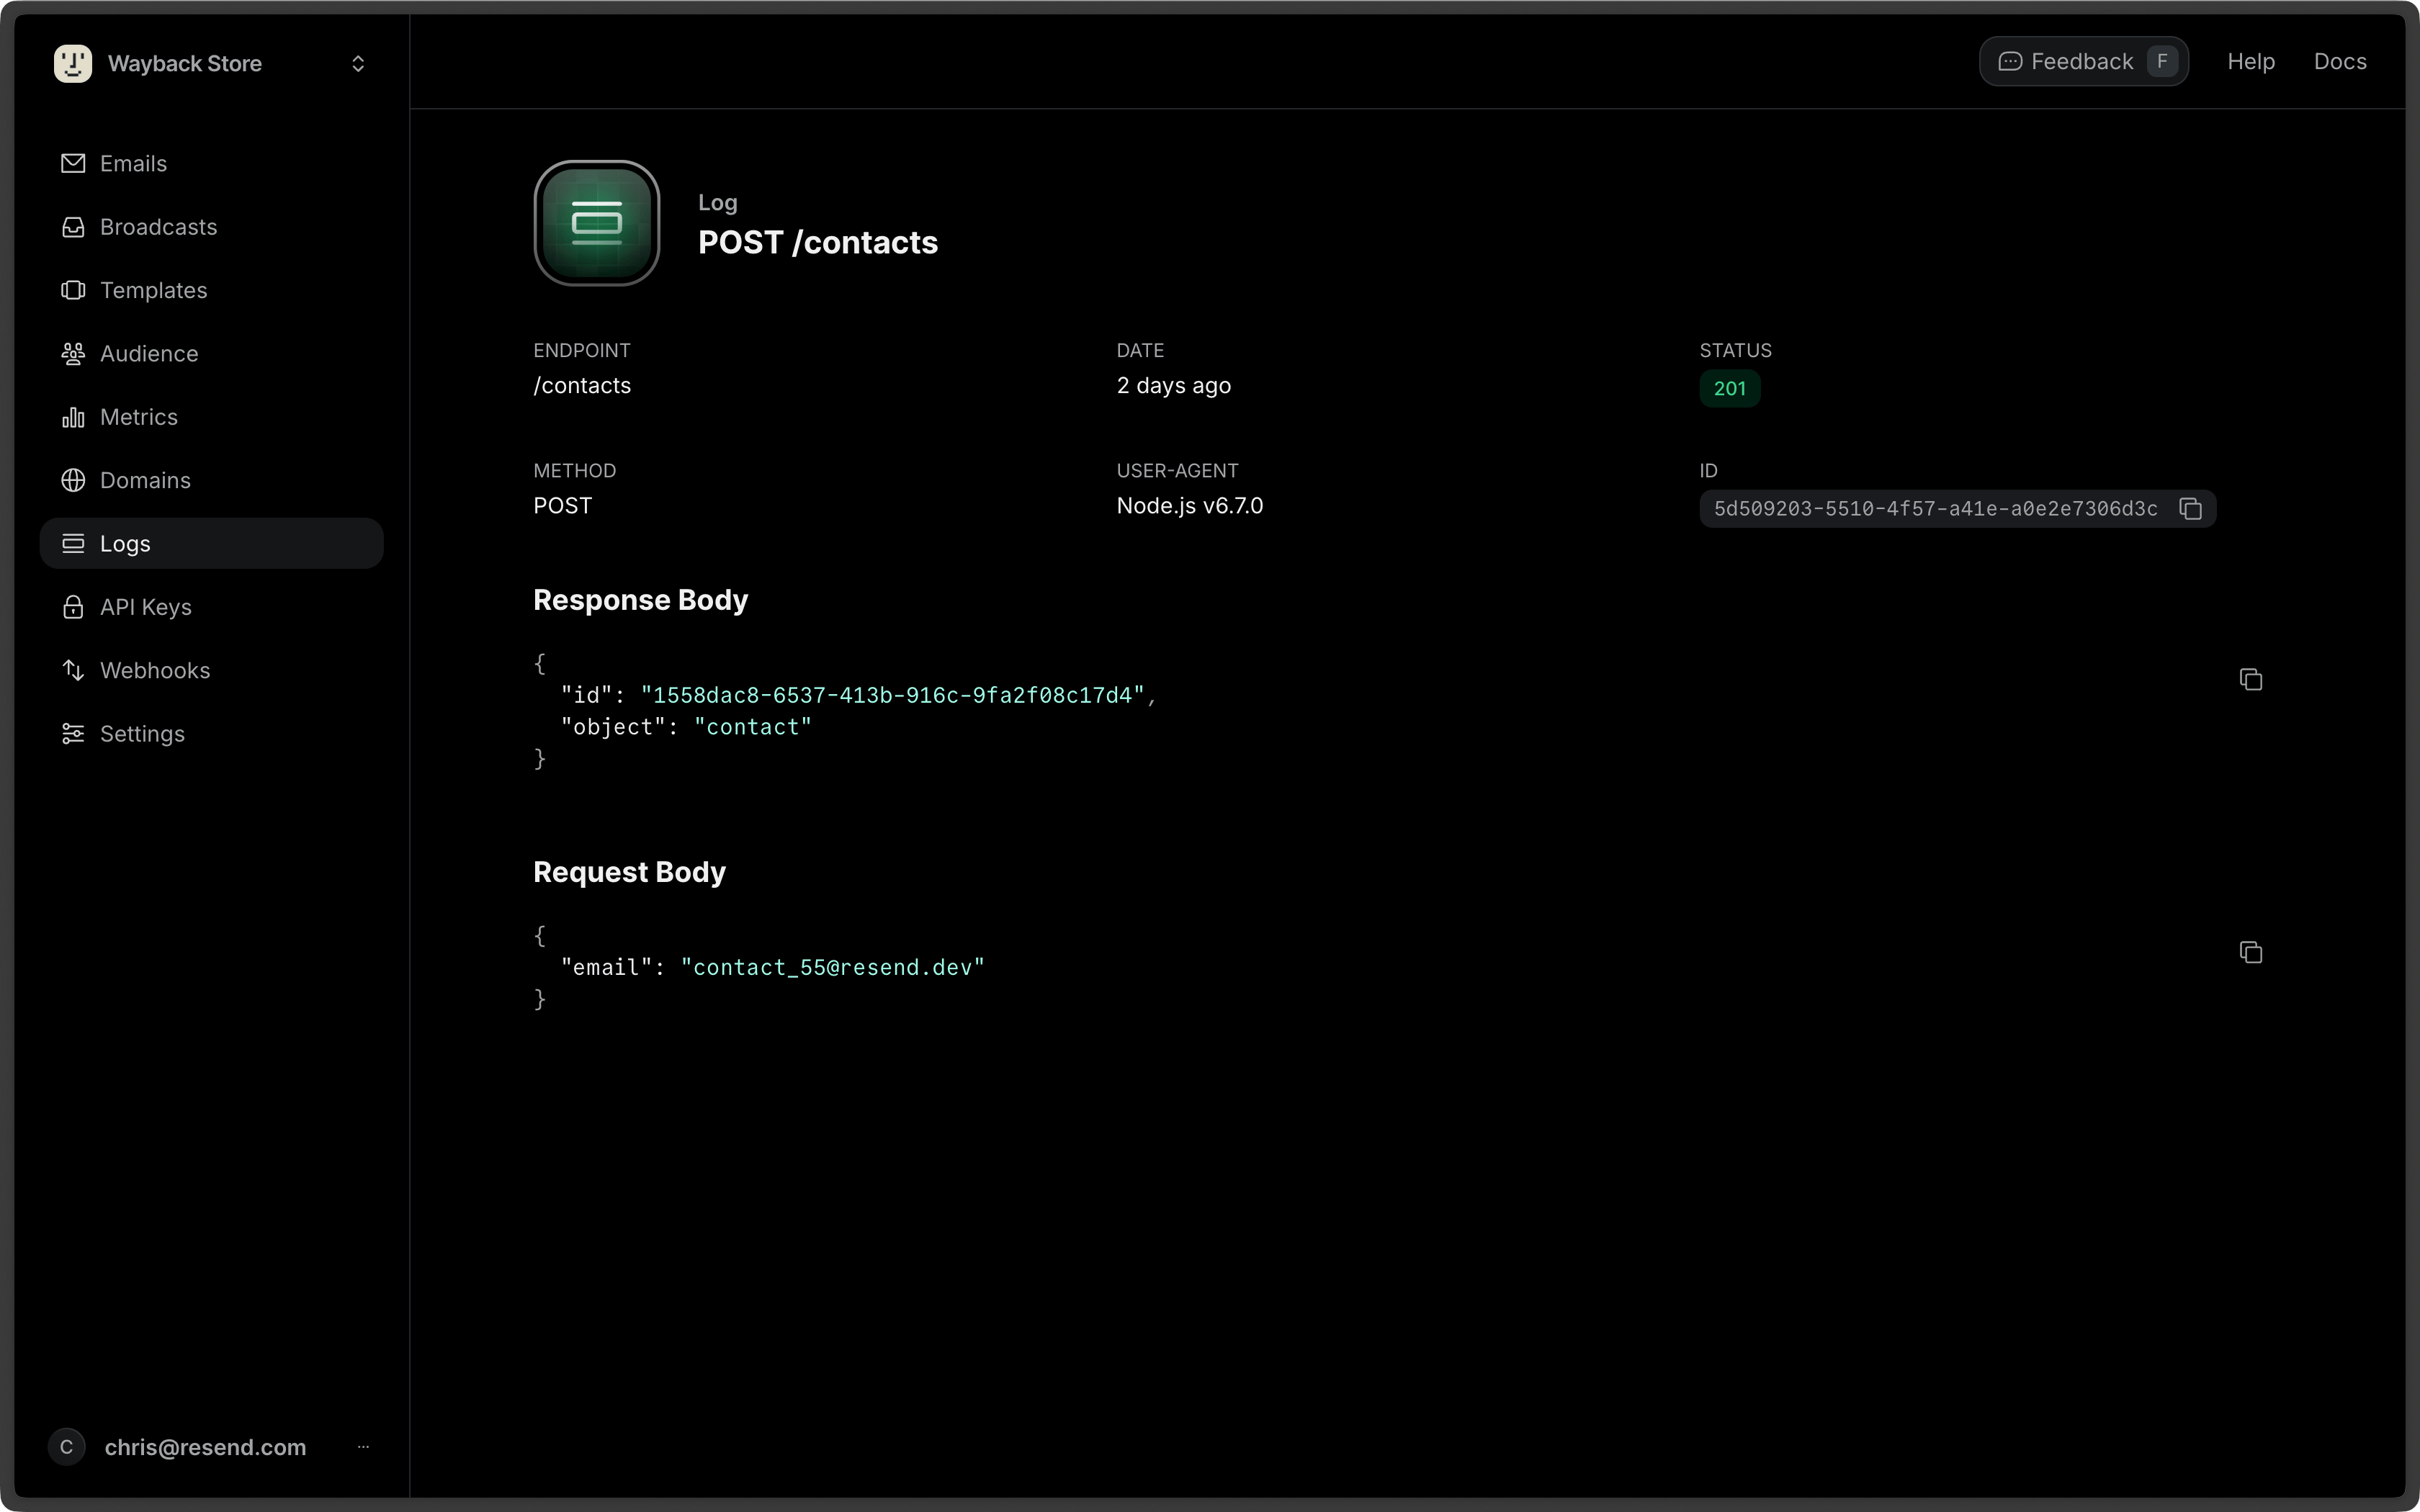
Request information
- Request body - The full JSON payload sent to the API (with copyable code blocks)
- HTTP method - GET, POST, etc.
- Endpoint - The API endpoint called
- User-Agent - The client or SDK used, with automatic SDK detection showing name and version
Response information
- Response body - The complete API response (with copyable code blocks)
- Status code - The HTTP status code returned
- Timestamp - When the request was processed
Related emails
When a log entry is associated with one or more email sends, an Email field appears in the log details, linking directly to the corresponding email records. The corresponding email's detail page includes a Log field linking to the API request log that triggered it, so you can trace the full request-to-delivery flow in both directions.
SDK detection
The dashboard automatically detects and displays Resend SDK information from the User-Agent header, showing:
- SDK name (e.g., "Resend Node.js")
- Version number
- Update notification when a newer SDK version is available
Troubleshooting errors
For supported error types, click the Help me fix button to open a troubleshooting drawer.
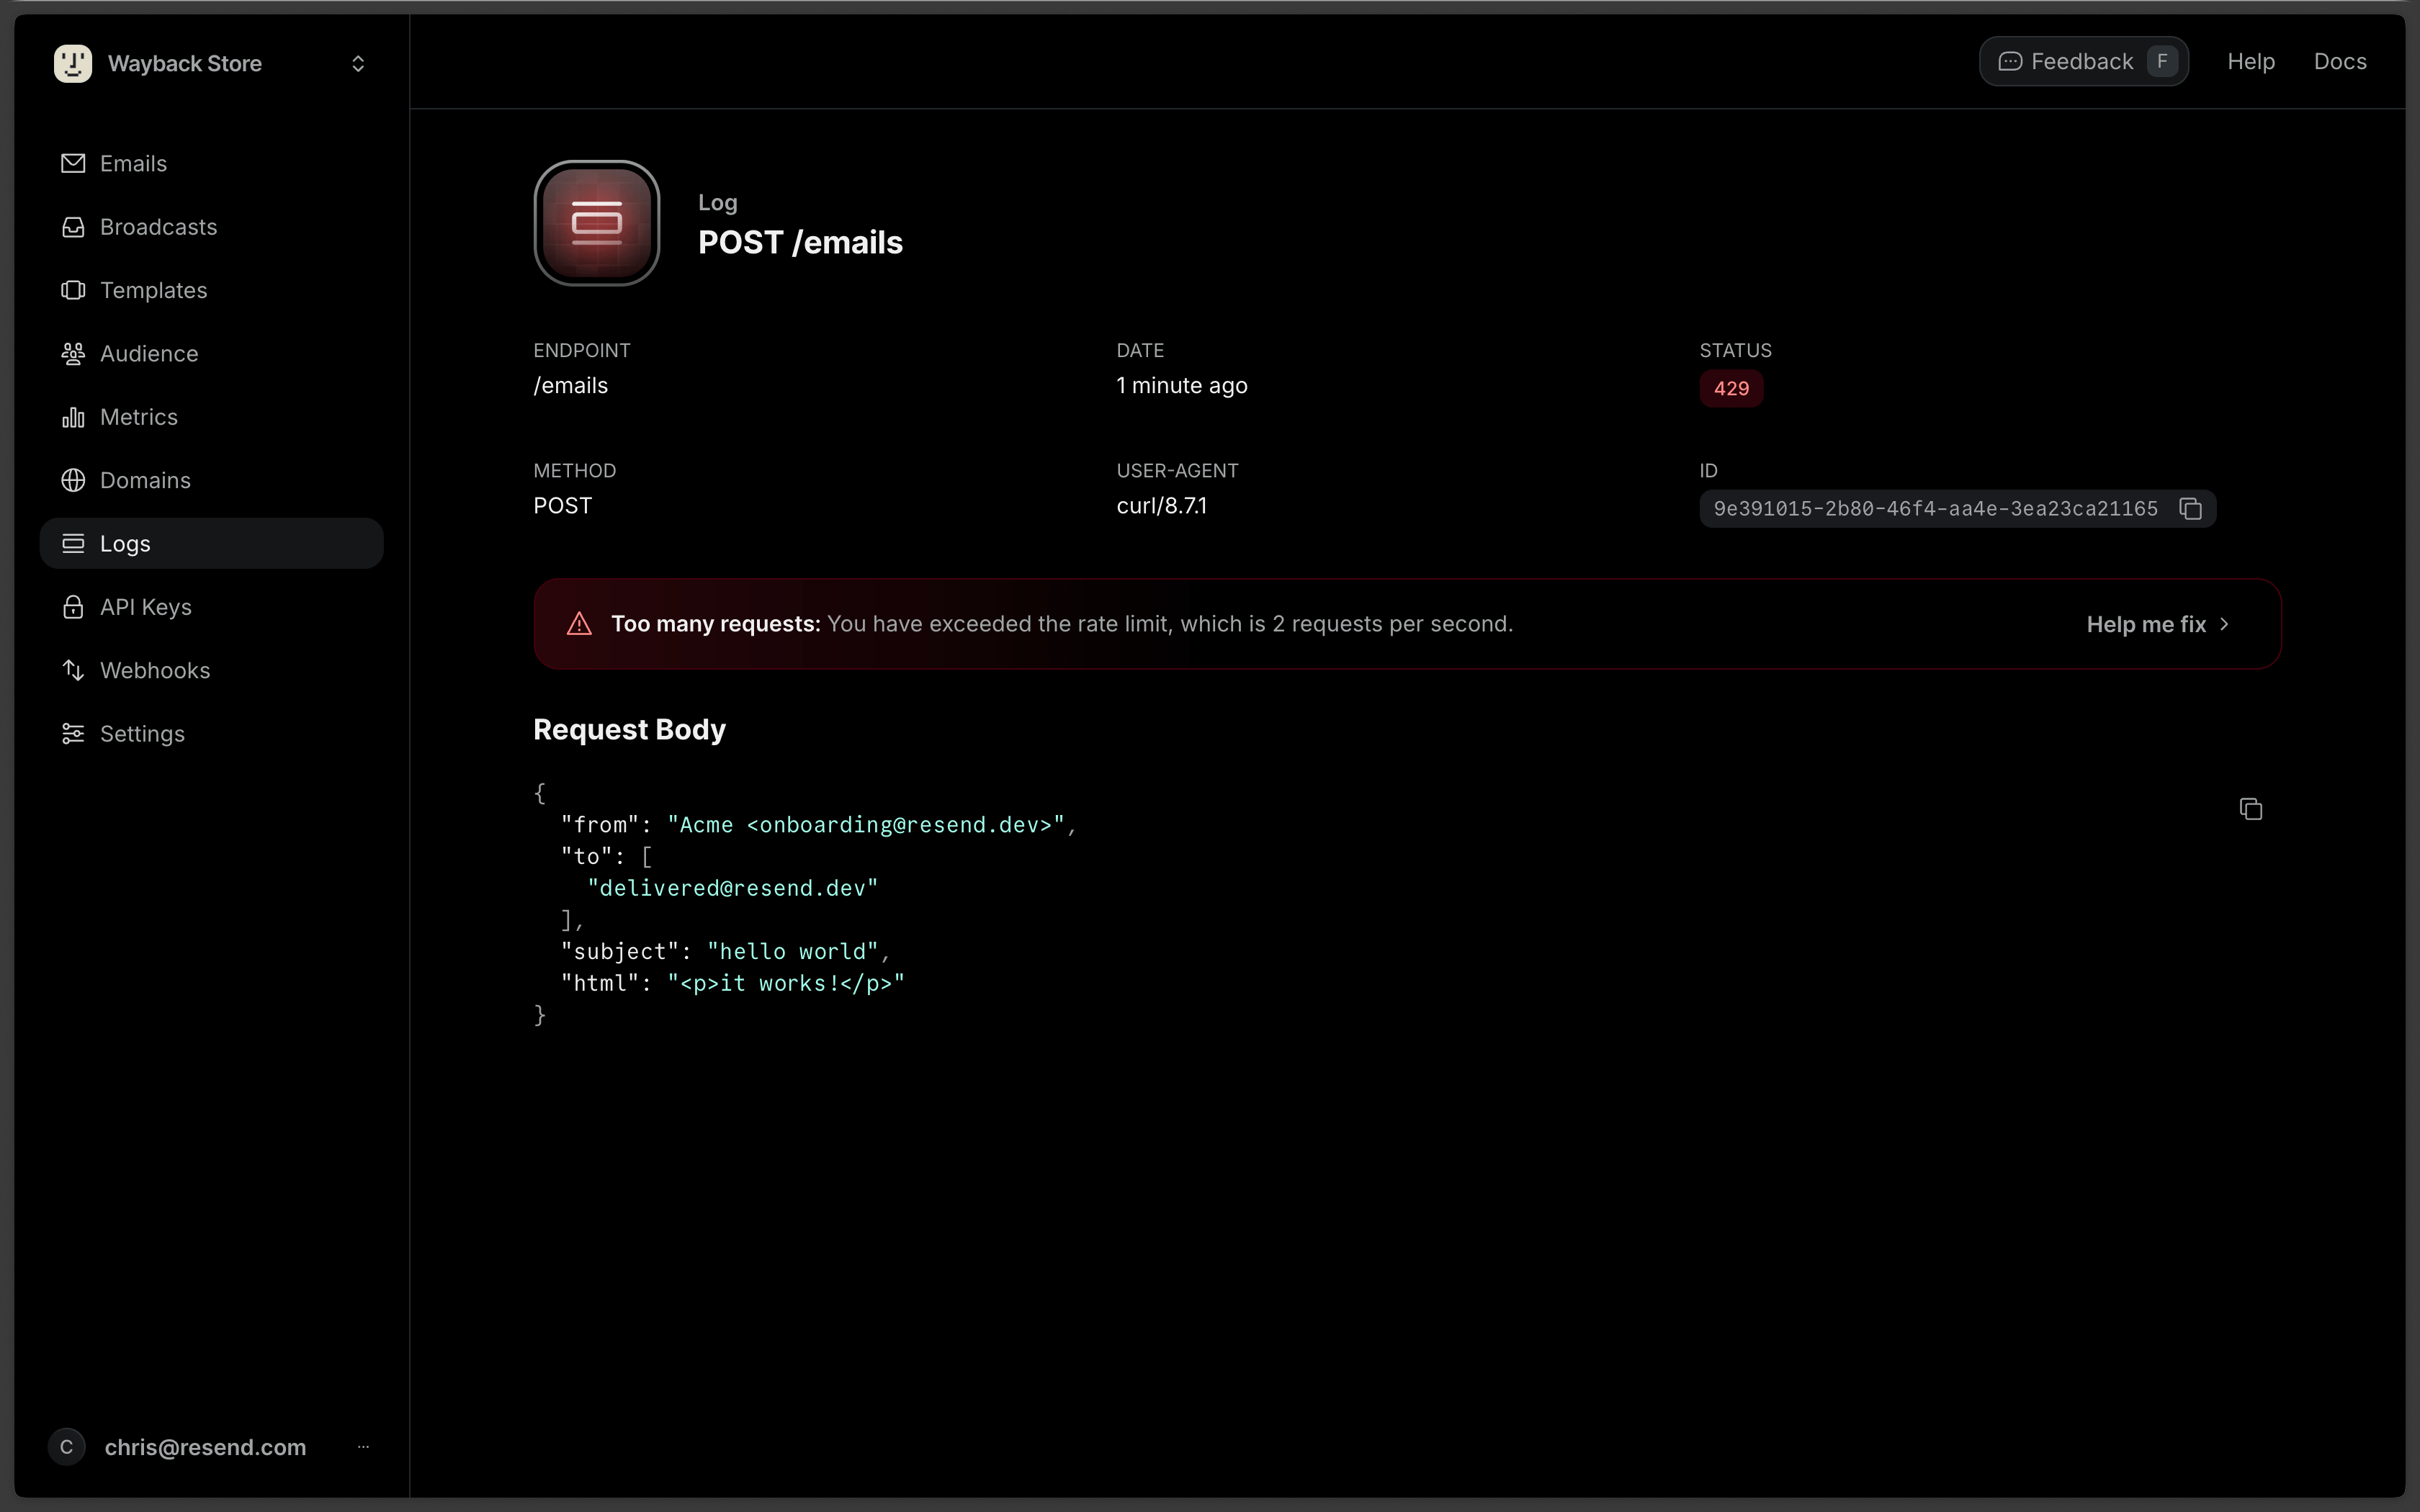
The drawer includes:
- Raw response - The complete API response
- Detailed guidance - Step-by-step instructions to resolve the issue
- Relevant links - Documentation and knowledge base articles
- Contextual information - Your current rate limits, verified domains, and other relevant data
Copy for AI
For error logs (4xx and 5xx status codes), use the Copy for AI dropdown to get help debugging:
- Copy log - Copy the log details as Markdown formatted for AI tools
- Open in ChatGPT - Open ChatGPT with the log prefilled for analysis
- Open in Claude - Open Claude with the log prefilled for analysis
The copied content includes the request method, endpoint, request body, response status, and response body to help AI assistants understand and troubleshoot the issue.
The Logs API allows you to programmatically retrieve logs. This is useful for integrating with your own systems, automating tasks, and equipping your AI agents with the ability to troubleshoot issues.
List logs
Retrieve a list of API request logs.
The response includes details such as:
- The endpoint called
- The response status code
- The user agent
import { Resend } from 'resend';

const resend = new Resend('re_xxxxxxxxx');

const { data, error } = await resend.logs.list();$resend = Resend::client('re_xxxxxxxxx');
$resend->logs->list();import resend
resend.api_key = "re_xxxxxxxxx"
resend.Logs.list()require "resend"
Resend.api_key = "re_xxxxxxxxx"
logs = Resend::Logs.list
puts logspackage main
import (
"context"
"github.com/resend/resend-go/v4"
)
func main() {
ctx := context.TODO()
client := resend.NewClient("re_xxxxxxxxx")
logs, err := client.Logs.ListWithOptions(ctx, nil)
if err != nil {
panic(err)
}
if logs.HasMore {
opts := &resend.ListOptions{
After: &logs.Data[len(logs.Data)-1].Id,
}
client.Logs.ListWithOptions(ctx, opts)
}
}use resend_rs::{Resend, Result, list_opts::ListOptions};
#[tokio::main]
async fn main() -> Result<()> {
let resend = Resend::new("re_xxxxxxxxx");
let _logs = resend
.logs
.list(ListOptions::default())
.await?;
Ok(())
}import com.resend.*;
import com.resend.core.exception.ResendException;
public class Main {
public static void main(String[] args) throws ResendException {
Resend resend = new Resend("re_xxxxxxxxx");
resend.logs().list();
}
}// C# SDK is not available yetcurl -X GET 'https://api.resend.com/logs' \
-H 'Authorization: Bearer re_xxxxxxxxx'resend logs listRetrieve log
Once you're ready to inspect a log in greater detail, you can use the Retrieve Log endpoint.
This endpoint returns the full request body and response, as well as the endpoint, status code, and user agent.
import { Resend } from 'resend';

const resend = new Resend('re_xxxxxxxxx');

const { data, error } = await resend.logs.get(
  '37e4414c-5e25-4dbc-a071-43552a4bd53b',
);$resend = Resend::client('re_xxxxxxxxx');
$resend->logs->get('37e4414c-5e25-4dbc-a071-43552a4bd53b');import resend
resend.api_key = "re_xxxxxxxxx"
resend.Logs.get("37e4414c-5e25-4dbc-a071-43552a4bd53b")require "resend"
Resend.api_key = "re_xxxxxxxxx"
log = Resend::Logs.get("37e4414c-5e25-4dbc-a071-43552a4bd53b")
puts logpackage main
import "github.com/resend/resend-go/v4"
func main() {
client := resend.NewClient("re_xxxxxxxxx")
client.Logs.Get("37e4414c-5e25-4dbc-a071-43552a4bd53b")
}use resend_rs::{Resend, Result};
#[tokio::main]
async fn main() -> Result<()> {
let resend = Resend::new("re_xxxxxxxxx");
let _logs = resend
.logs
.get("37e4414c-5e25-4dbc-a071-43552a4bd53b")
.await?;
Ok(())
}import com.resend.*;
import com.resend.core.exception.ResendException;
public class Main {
public static void main(String[] args) throws ResendException {
Resend resend = new Resend("re_xxxxxxxxx");
resend.logs().get("37e4414c-5e25-4dbc-a071-43552a4bd53b");
}
}// C# SDK is not available yetcurl -X GET 'https://api.resend.com/logs/37e4414c-5e25-4dbc-a071-43552a4bd53b' \
-H 'Authorization: Bearer re_xxxxxxxxx'resend logs get 37e4414c-5e25-4dbc-a071-43552a4bd53bExport your data
Section titled “Export your data”Admins can download your data in CSV format for the following resources:
- Emails
- Broadcasts
- Contacts
- Segments
- Domains
- Logs
- API keys
To start, apply filters to your data and click on the "Export" button. Confirm your filters before exporting your data.
If your exported data includes 1,000 items or less, the export will download immediately. For larger exports, you'll receive an email with a link to download your data.
All admins on your team can securely access the export for 7 days. Unavailable exports are marked as "Expired."